![90s.pm.investing [EN]](https://substackcdn.com/image/fetch/$s_!gwa6!,w_120,h_120,c_fill,f_webp,q_auto:good,fl_progressive:steep/https%3A%2F%2Fsubstack-post-media.s3.amazonaws.com%2Fpublic%2Fimages%2F101bbd96-f32d-47f3-bb0e-9c76efa580c0_1054x1054.png)
META - We Draw Tree
Is Capex the Growth Engine, or the Enemy of Free Cash Flow? Hypothesis Driven | Mutually Exclusive | Collectively Exhaustive


I. Who Is Meta?
Meta Platforms is the world’s largest social media ecosystem operator, owning Facebook, Instagram, WhatsApp, Messenger, and Threads, with a combined daily active people (DAP) count of 3.56 billion. Founded in 2004 by Mark Zuckerberg, the company’s core DNA is “exchange free services for attention, then monetize attention as advertising revenue”—essentially a data-driven ad auction machine, with advertising revenue consistently representing 97–98%+ of total revenue.[^1][^2]
The fundamental differentiation from Alphabet (Google Search + YouTube) and Amazon (e-commerce intent advertising) lies in Meta’s dual-graph structure: a social relationship graph plus an interest graph. This gives Meta competitive standing in both brand advertising and performance advertising through discovery commerce rather than pure search-intent advertising. This characteristic makes Meta more reliant on the quality of its AI recommendation algorithms — the stronger the algorithm, the more relevant the ad impressions, the higher the ROAS (return on ad spend), and the higher the CPM (cost per thousand impressions) advertisers are willing to pay.[^3][^4]
II. How Does It Make Money?
Meta’s revenue structure can be precisely summarized by a single identity:
Q1 2026 data: advertising revenue of $55.0 billion, up 33% year-over-year, driven by two simultaneous factors — impression volume growth of 19% and average price per ad growth of 12%, both in double digits at the same time. This is the starting point of the research thesis: the 33% ad revenue growth rate is the result of both volume and price acting together, not any single factor’s breakthrough.[^7][^8][^9]
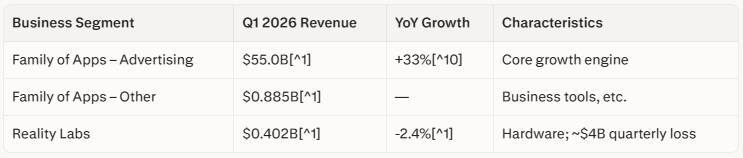
The 2026 full-year capex guidance stands at $125–145 billion, nearly double 2025’s $72.2 billion; simultaneously, management committed that 2026 operating income would exceed 2025’s $83.28 billion. This combination — capex doubling while operating income continues to grow — is the core of the market’s debate: is capex eroding FCF, or is it buying future growth?[^11][^9][^1]
III. What Has Meta Been Up To Lately?
The three developments over the past six months most consequential to the research thesis:
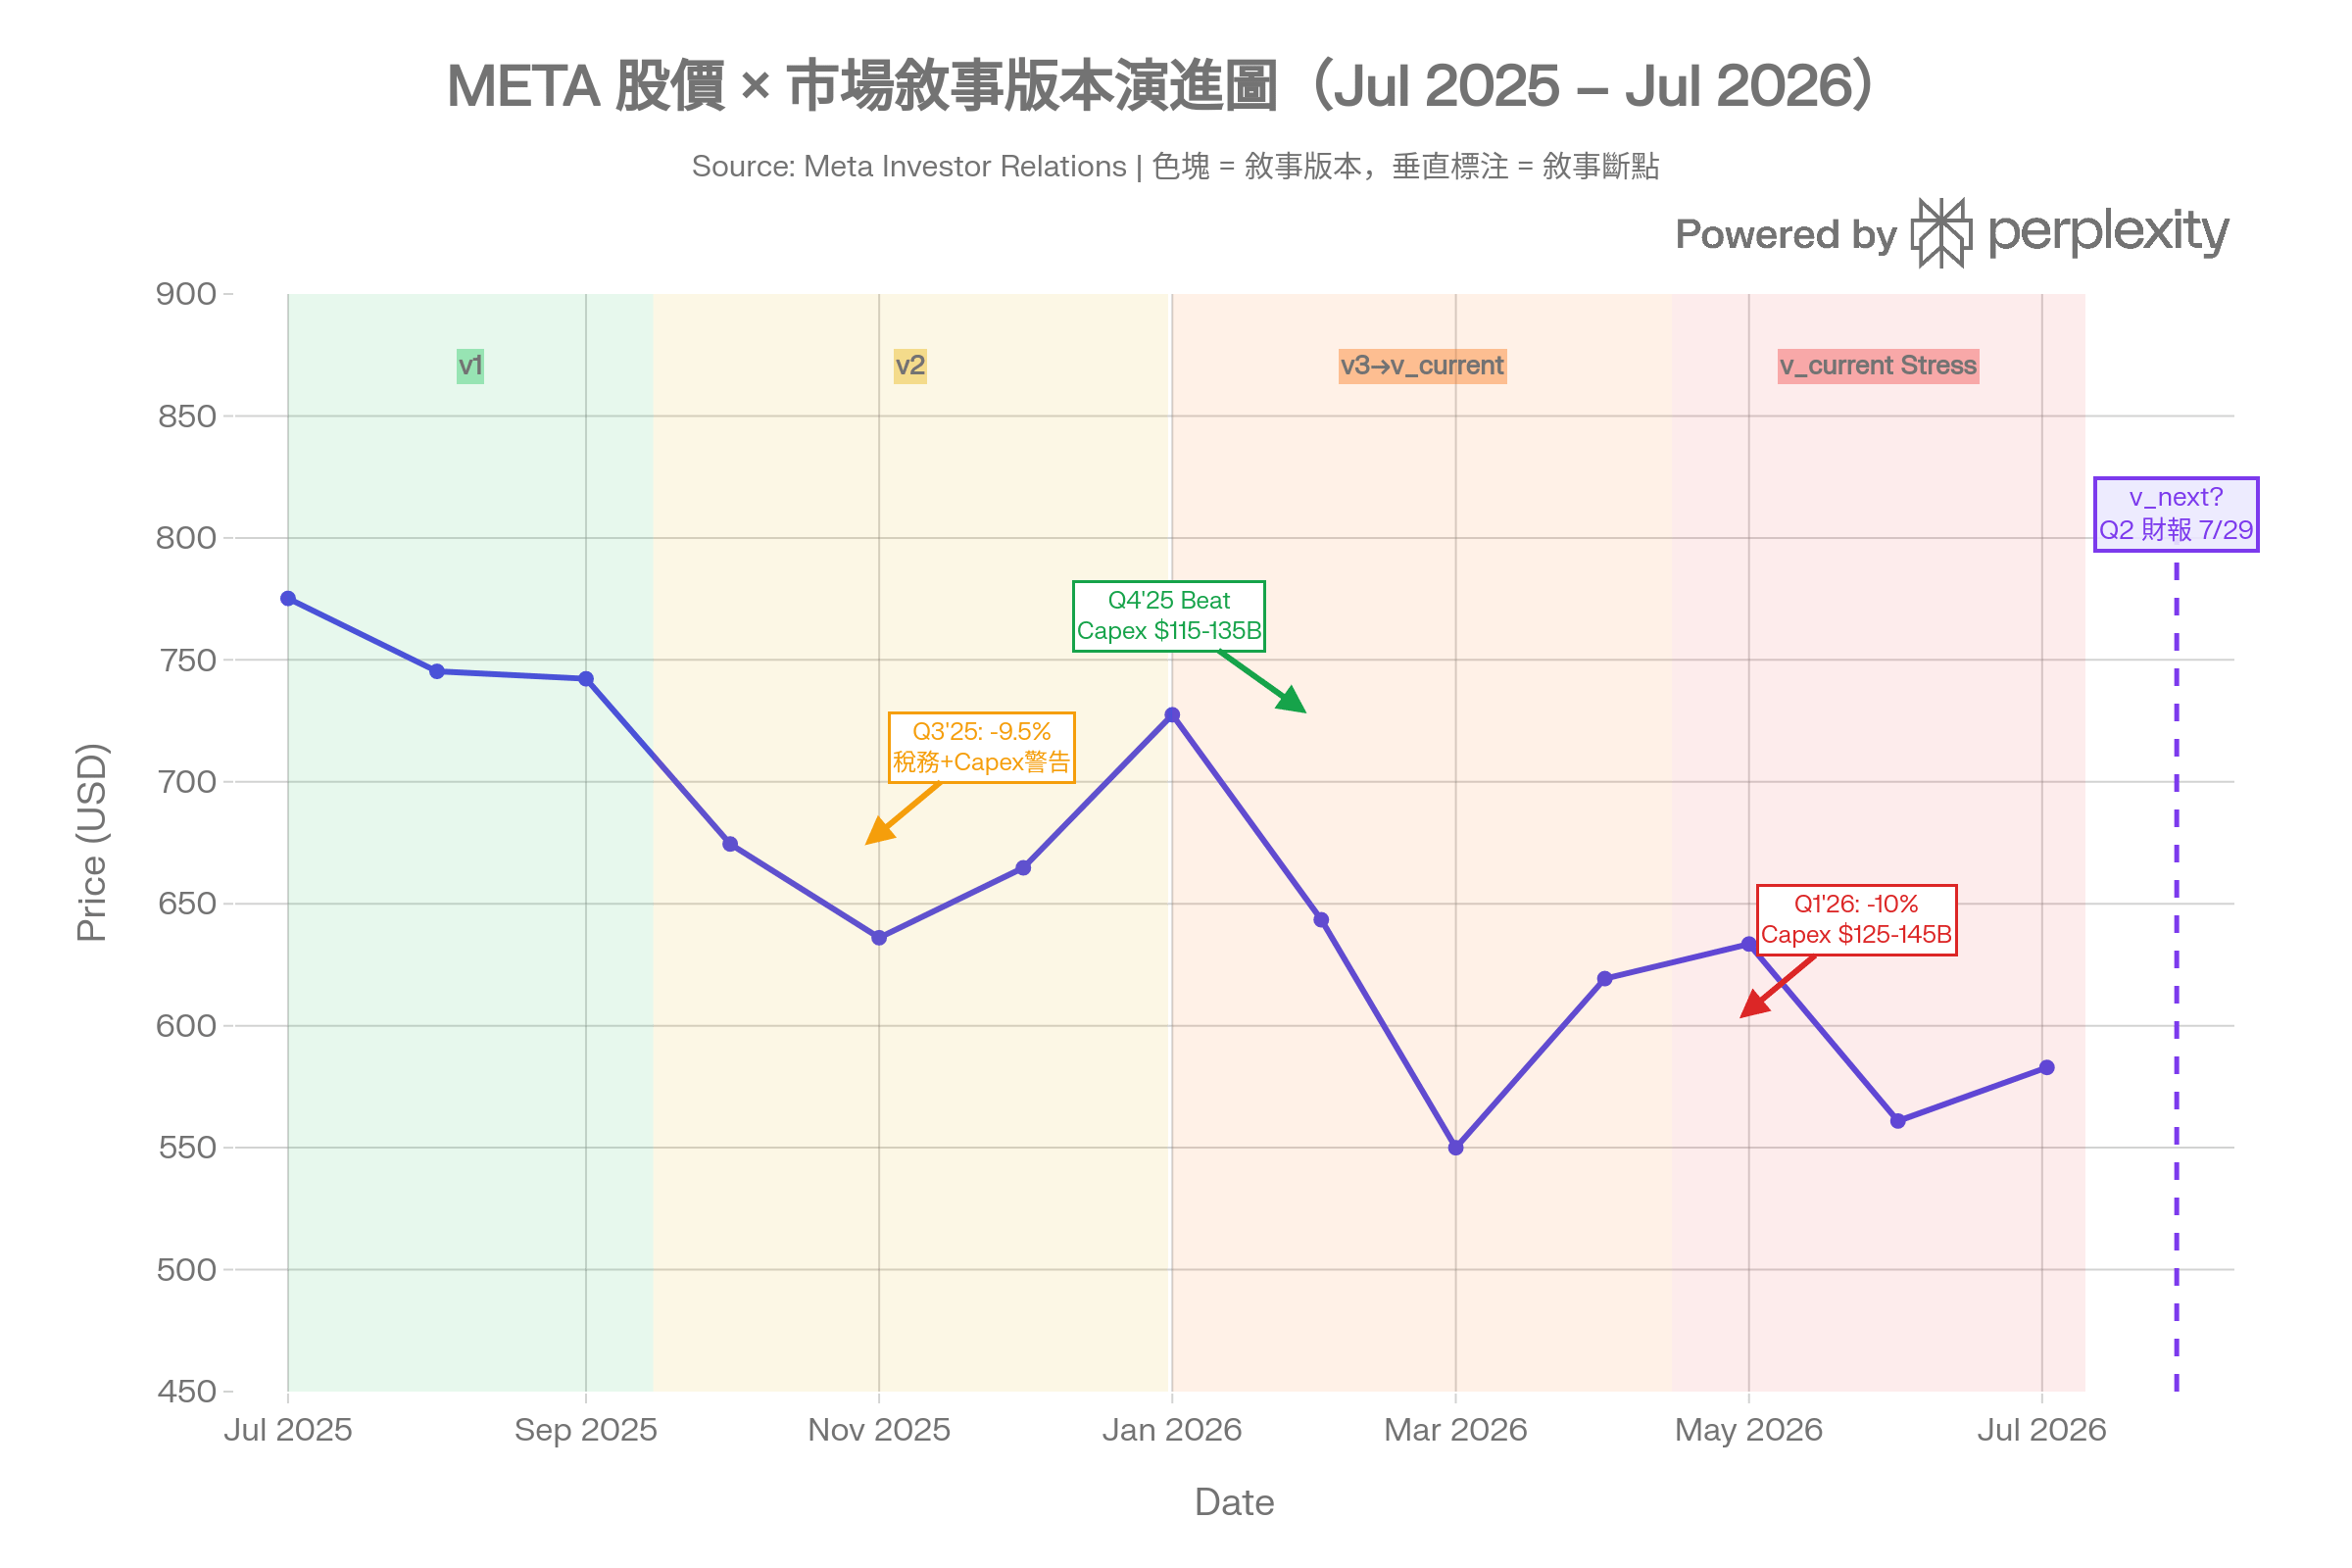
Second Capex Upward Revision (April 2026): In the Q1 2026 earnings report, capex guidance was raised again from $115–135 billion to $125–145 billion, directly triggering a -8.5% stock decline. CFO Susan Li acknowledged the company had “repeatedly underestimated compute demand,” deepening market skepticism about ROI.[^12][^11][^1]
33% Ad Growth Confirmed (Q1 2026): This was the fastest revenue growth since 2021. Excluding the $8.03 billion one-time tax benefit, adjusted EPS was $7.31, still beating the Street’s consensus estimate of $6.65–6.67. Polymarket had assigned approximately 90% probability of a beat before the earnings release, with Street EPS consensus at $6.67.[^13][^10][^9][^1]
AI Tool Adoption Accelerating: Business AI conversation volume surged from 1 million weekly at the start of 2026 to 10 million weekly by end of March — a 10x increase in three months. The number of advertisers using generative AI creative tools grew from 4 million to 8 million; advertisers using video generation tools saw conversion rate improvements exceeding 3%.[^4][^14][^1]
IV. Market Consensus
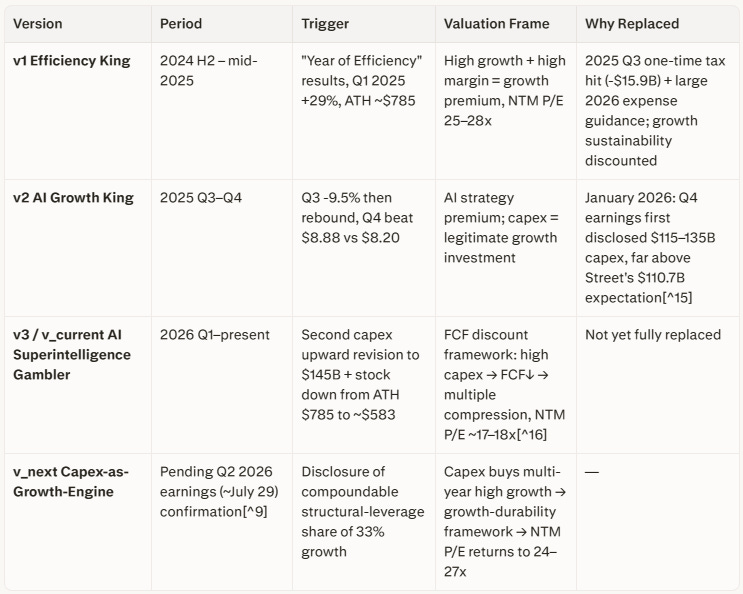
Narrative Evolution
Market Narrative (v_current)
Bear case: Capex doubled from $72.2B in 2025 to $145B, FCF already declined 19.4% in 2025; Reality Labs remains a ~$4B quarterly loss center; CFO explicitly acknowledged “continuing to underestimate compute demand,” and 2027 capex is unestimatable. Q1 EPS of $10.44 includes $8.03B in tax benefits; ex-items EPS of $7.31 means “true” earnings power is overstated.[^17][^12][^1]
Bull case: Q1 2026 ad revenue +33% is the fastest growth since 2021; impressions +19% and price per ad +12% both firing strongly simultaneously; AI ROIC (return on invested capital) exceeds 20%, cash ROIC exceeds 52%; Advantage+ annualized run rate already above $20B, up 70% YoY; Zuckerberg confirmed AI ad-ranking revenue contribution is 4x that of simply adding more ad load.[^10][^9][^3][^4]
Already priced in:
Meta has AI capability (capex scale = signal of seriousness)
33% growth is the Q1 2026 actuals (announced fact, not forecast)
Capex will suppress near-term FCF
Not yet priced in:
The causal link between capex and growth durability (whether volume and price leverage can compound for multiple years)
What share of the 33% growth consists of compoundable structural leverage (vs. one-time bonus)
Whether FCF recovers in 2027–2028 as the growth runway extends
Pricing logic: Current NTM P/E of ~17–18x sits below the company’s own 5-year average of ~25x and 10-year average of ~30x, and well below the v1 ATH-period band of 25–28x. The market is discounting the current AI capex story with the same level of discount applied during the 2022 “VR spending panic” (when NTM P/E fell as low as ~9x) — yet the advertising business’s actual growth rate is not remotely comparable to the 2022 contraction period.[^16][^18]
V. Core Hypothesis (The Proposition Under Test)
H-0 (Directly inherited from Framework Agent Level 0):
Can Meta prove, over 2026–2027, that its $145B AI capex is buying the structural durability of core ad revenue growth, shifting the valuation frame from “an ad company whose capex erodes FCF” to “a high-growth platform where capex is the growth engine”?
Proposition path: Meta triggers the v_current → v_next frame switch only if three structural signals are confirmed simultaneously:
Q2 2026 (July 29) ad revenue growth holds at ~25%+ against the backdrop of doubled capex, proving the growth trajectory has not been broken by capex burden
Management provides named guidance on compoundable-leverage share (Advantage+ scale, new-surface ramp rates, SMB base expansion)
FCF decline does not worsen, or shows marginal improvement (Operating Cash Flow remains strong)
VI. The Investment Hypothesis Map
MECE rationale in plain terms: Ad revenue = impression volume (quantity) × average price per impression (price). Volume and price are the two multiplicative factors of ad growth — mutually exclusive (ME). Durability is the time-decay rate of those two gains, mathematically equivalent to the slope of the compounding growth exponent, exhausting all mathematical sources of ad growth (CE). There is no fourth source.
